Warren Buffett created a very simple indicator to tell you whether stocks were expensive or cheap.
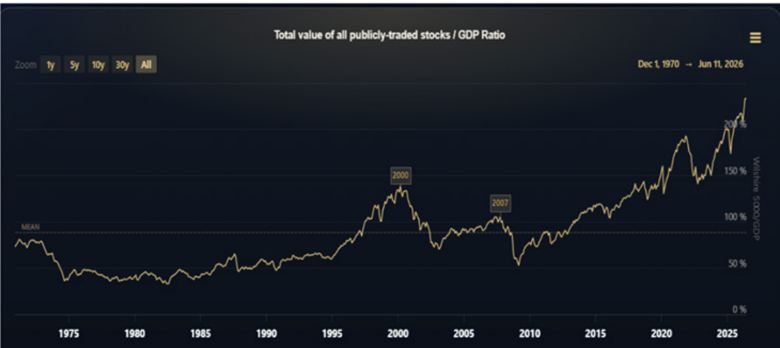
The Buffett Indicator is a simple ratio that compares the value of all publicly traded stocks (as represented by the Wilshire 5000), with US GDP. The rationale makes sense. Publicly traded companies should not be worth more than the entire GDP of the US. They are a subset of US GDP… so you’d expect the price to be somewhat less than the entire output of the US economy.
Buffett says that when the ratio gets above the long-term average (around 75%) stocks are expensive. If you only ever bought stocks below the average and sold them when they got 100% over GDP, you’d do way better than most investors.
Today, the Buffett Indicator shows that stocks are at all-time highs relative to GDP – at 200%!
US GDP is $32 trillion. The Wilshire 5000 market cap is now over $74 trillion.
Previous highs in 2000 and 2007 only got to 150% and 100%…
Why does the Buffett Indicator matter? What does it have to do with gold or gold stocks?
As I wrote to my GPIV subscribers last week in my Q2 update:
“Every time the Buffett indicator peaked Gold went on a 10 year run. The 1970s Gold rose 1,800% from $42/oz to $800/oz, 2000 ran 582% from $260/oz to $1,772/oz and so far since 2021 Gold’s up 139% from $1,750/oz to $4,188/oz. It’s early in this move because the Buffett indicator hasn’t even begun to turn down yet. Gold is going higher.”
Stocks are still screaming higher, pushing the Buffett Indicator to the highest levels we’ve ever seen, meaning stocks are as overvalued as we’ve ever seen.
Why do gold and gold stocks do well when the Buffett Indicator falls from a peak? Two reasons: gold stocks are typically underowned during a broad stock market rally. People push valuations up on flashy tech stocks, and ignore the gold sector entirely. By the time the market starts turning down, the gold sector is one of the few areas with appealing valuations.
Another big reason: market downturns mean the US Government will step in to provide “liquidity” aka – massive money printing.
We saw it in 2007. We saw it during Covid. If stocks turn down, the Fed steps in and blasts cash into the system.
The result is higher inflation, higher gold prices and along with attractive valuations in gold stocks, the sector tends to do very well.
As someone who owns stocks, it’s of course not great news that we’re likely to see a massive decline at some point.
But as a gold investor? I’m excited about what will come next.
I’ve even put together a short report on how gold can fit into your retirement. Check it out here for free.

And look: gold is down 20% from its highs. It’s technically bumbling through a bear market at the moment.
But the good news is that gold is still over $4k/oz and the bulk of the mining stocks I cover are selling for extremely attractive valuations.
The sector has been left for dead. Anyone with the foresight to buy at these levels is going to be rewarded handsomely.
Best,
Garrett Goggin, CFA, CMT
Lead Analyst and Founder, Golden Portfolio